AI agent monitoring: every run, every token, every dollar
The Agent Dashboard records every prompt turn your agents take — the agent, the model, the channel, the tool calls, the tokens and what it cost — and puts the conversations happening right now next to the thousands that already finished.
There is nothing to instrument. Install the application and the next turn any agent takes is already a row in the table.
From no visibility to a full ledger in three steps
1. Install the application
No changes to your agents, your abilities or your prompts. The dashboard attaches itself to the conversation service every agent turn already runs through.
2. Let your agents work
A run record opens the moment a turn starts and closes when it ends. Tokens, cost, LLM calls and tool calls accumulate as each model response comes back, so a turn in progress is never a blank row.
3. Open the dashboard
Three views over the same data: a timeline of what your agents have been doing, a searchable ledger of finished runs, and a live table of the conversations generating right now.
Every prompt turn is a run
Not a sample, not the interesting ones, and not only the long ones: every turn that reaches an agent gets its own record, whether it came from a chat window, a phone call or an inbox. That is what makes the totals mean something.
What each run keeps
- Who and what. The conversation, the user it belonged to, the agent that answered, the model it used and the channel it arrived on.
- The work done. How many times the model was called, how many tools it called, and how many of those succeeded or failed.
- The bill. Input tokens, output tokens and the cost of the turn, priced per token against your model pricing.
- The outcome. Pending, running, paused, completed or failed — with the error message kept on the record when something went wrong.
- The clock. Start time, end time and the duration, so a slow turn is visible as a slow turn.
And it behaves like a real table
- Paged on the server. Ten to a hundred rows at a time, ordered newest first, indexed for it — the table stays fast at five thousand runs and at five hundred thousand.
- Sorted on the column you clicked. Cost, tokens, agent, model, status, start time — the sort happens in the database, not in your browser on one page of results.
- Filtered by status and run type, so “show me the failures” is two clicks.
- Searchable by conversation id, user id, agent, model or error text.
- Linked back to the conversation. The conversation id in each row opens that conversation in the chat.
The three questions people ask about AI agents
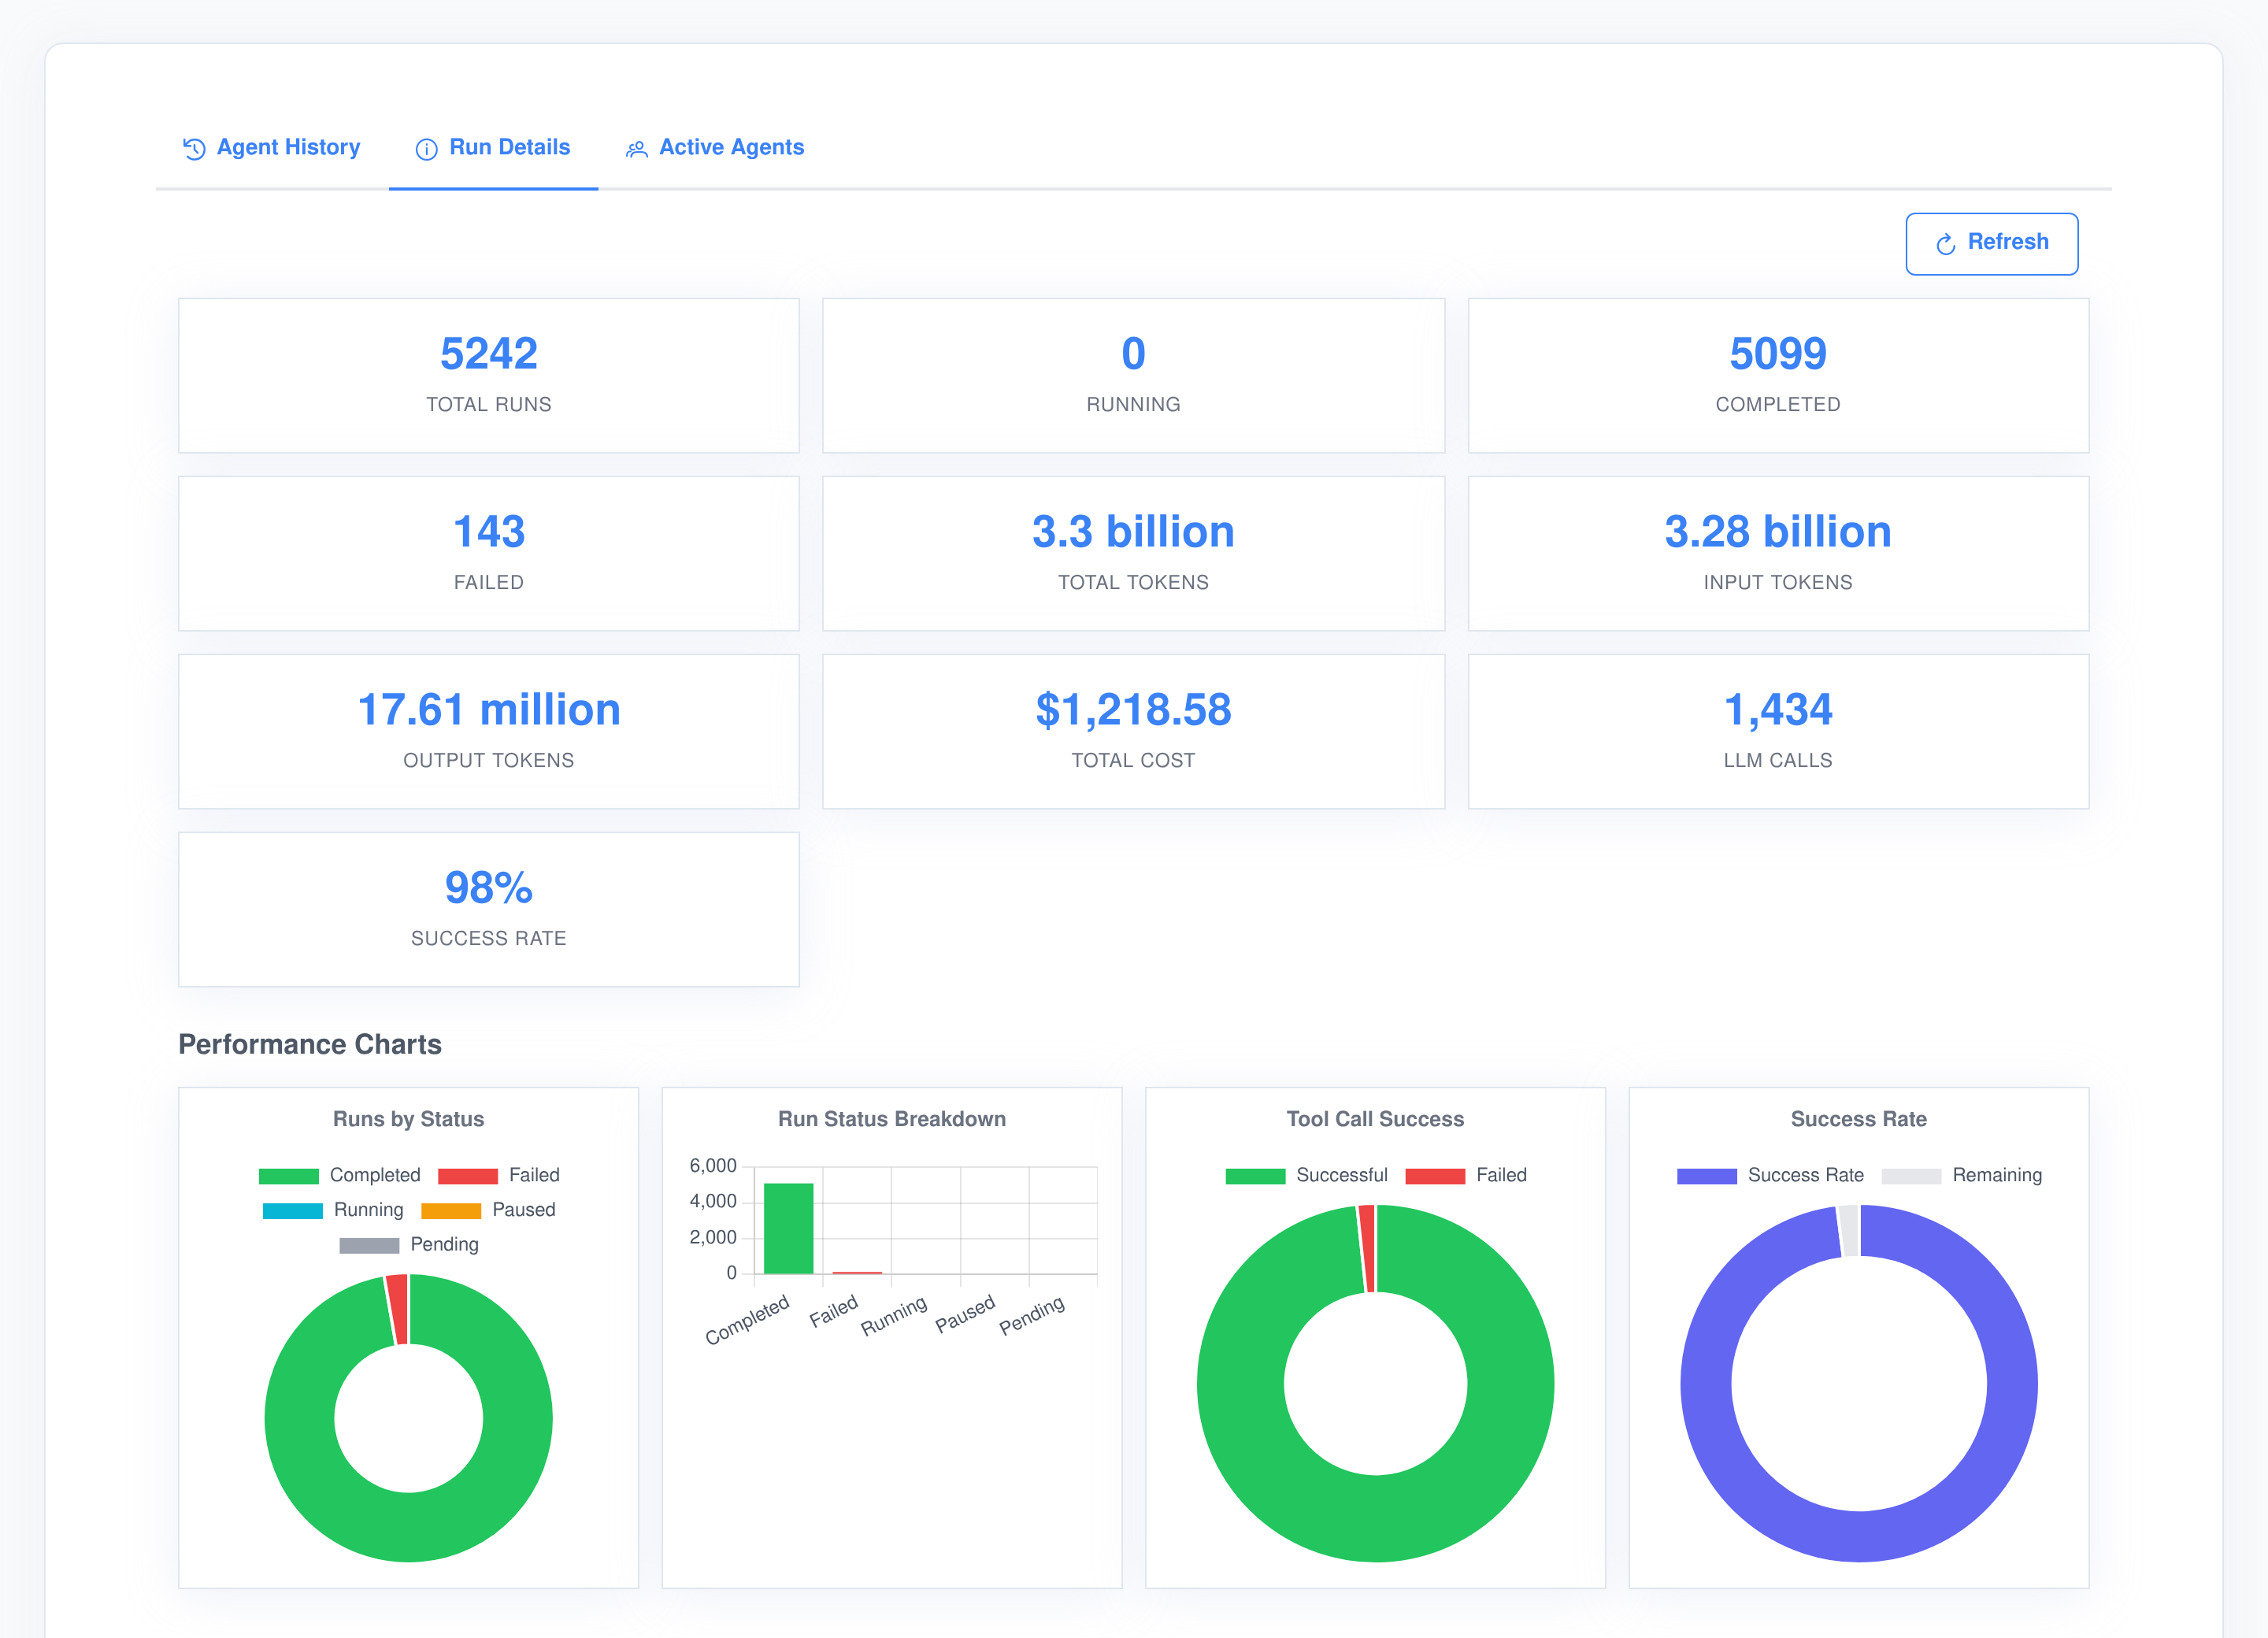
What are they costing us, are they working, and how much are they actually doing? The tiles answer all three at a glance, and the totals behind them are aggregated in the database over exactly the runs you are allowed to see — so the number on the tile always matches the rows in the table underneath it.
Spend you can put in a sentence
- Cost is calculated from the input and output token counts of each message against the per-token rates you configured for that model, not estimated from a round number.
- Input and output tokens are counted separately, everywhere — on the tiles, on each run, and on each message inside a run.
- Because every turn is recorded, “what did agents cost us this month” is a sum, not a projection.
Reliability you can act on
- Successful and failed tool calls are counted per run, and rolled up into a success rate over everything.
- Failed runs keep the error message that ended them, so a bad afternoon is a filter away from an explanation.
- Runs by status shows, in one ring, whether your failures are a rounding error or a pattern.
Find the run somebody is asking about
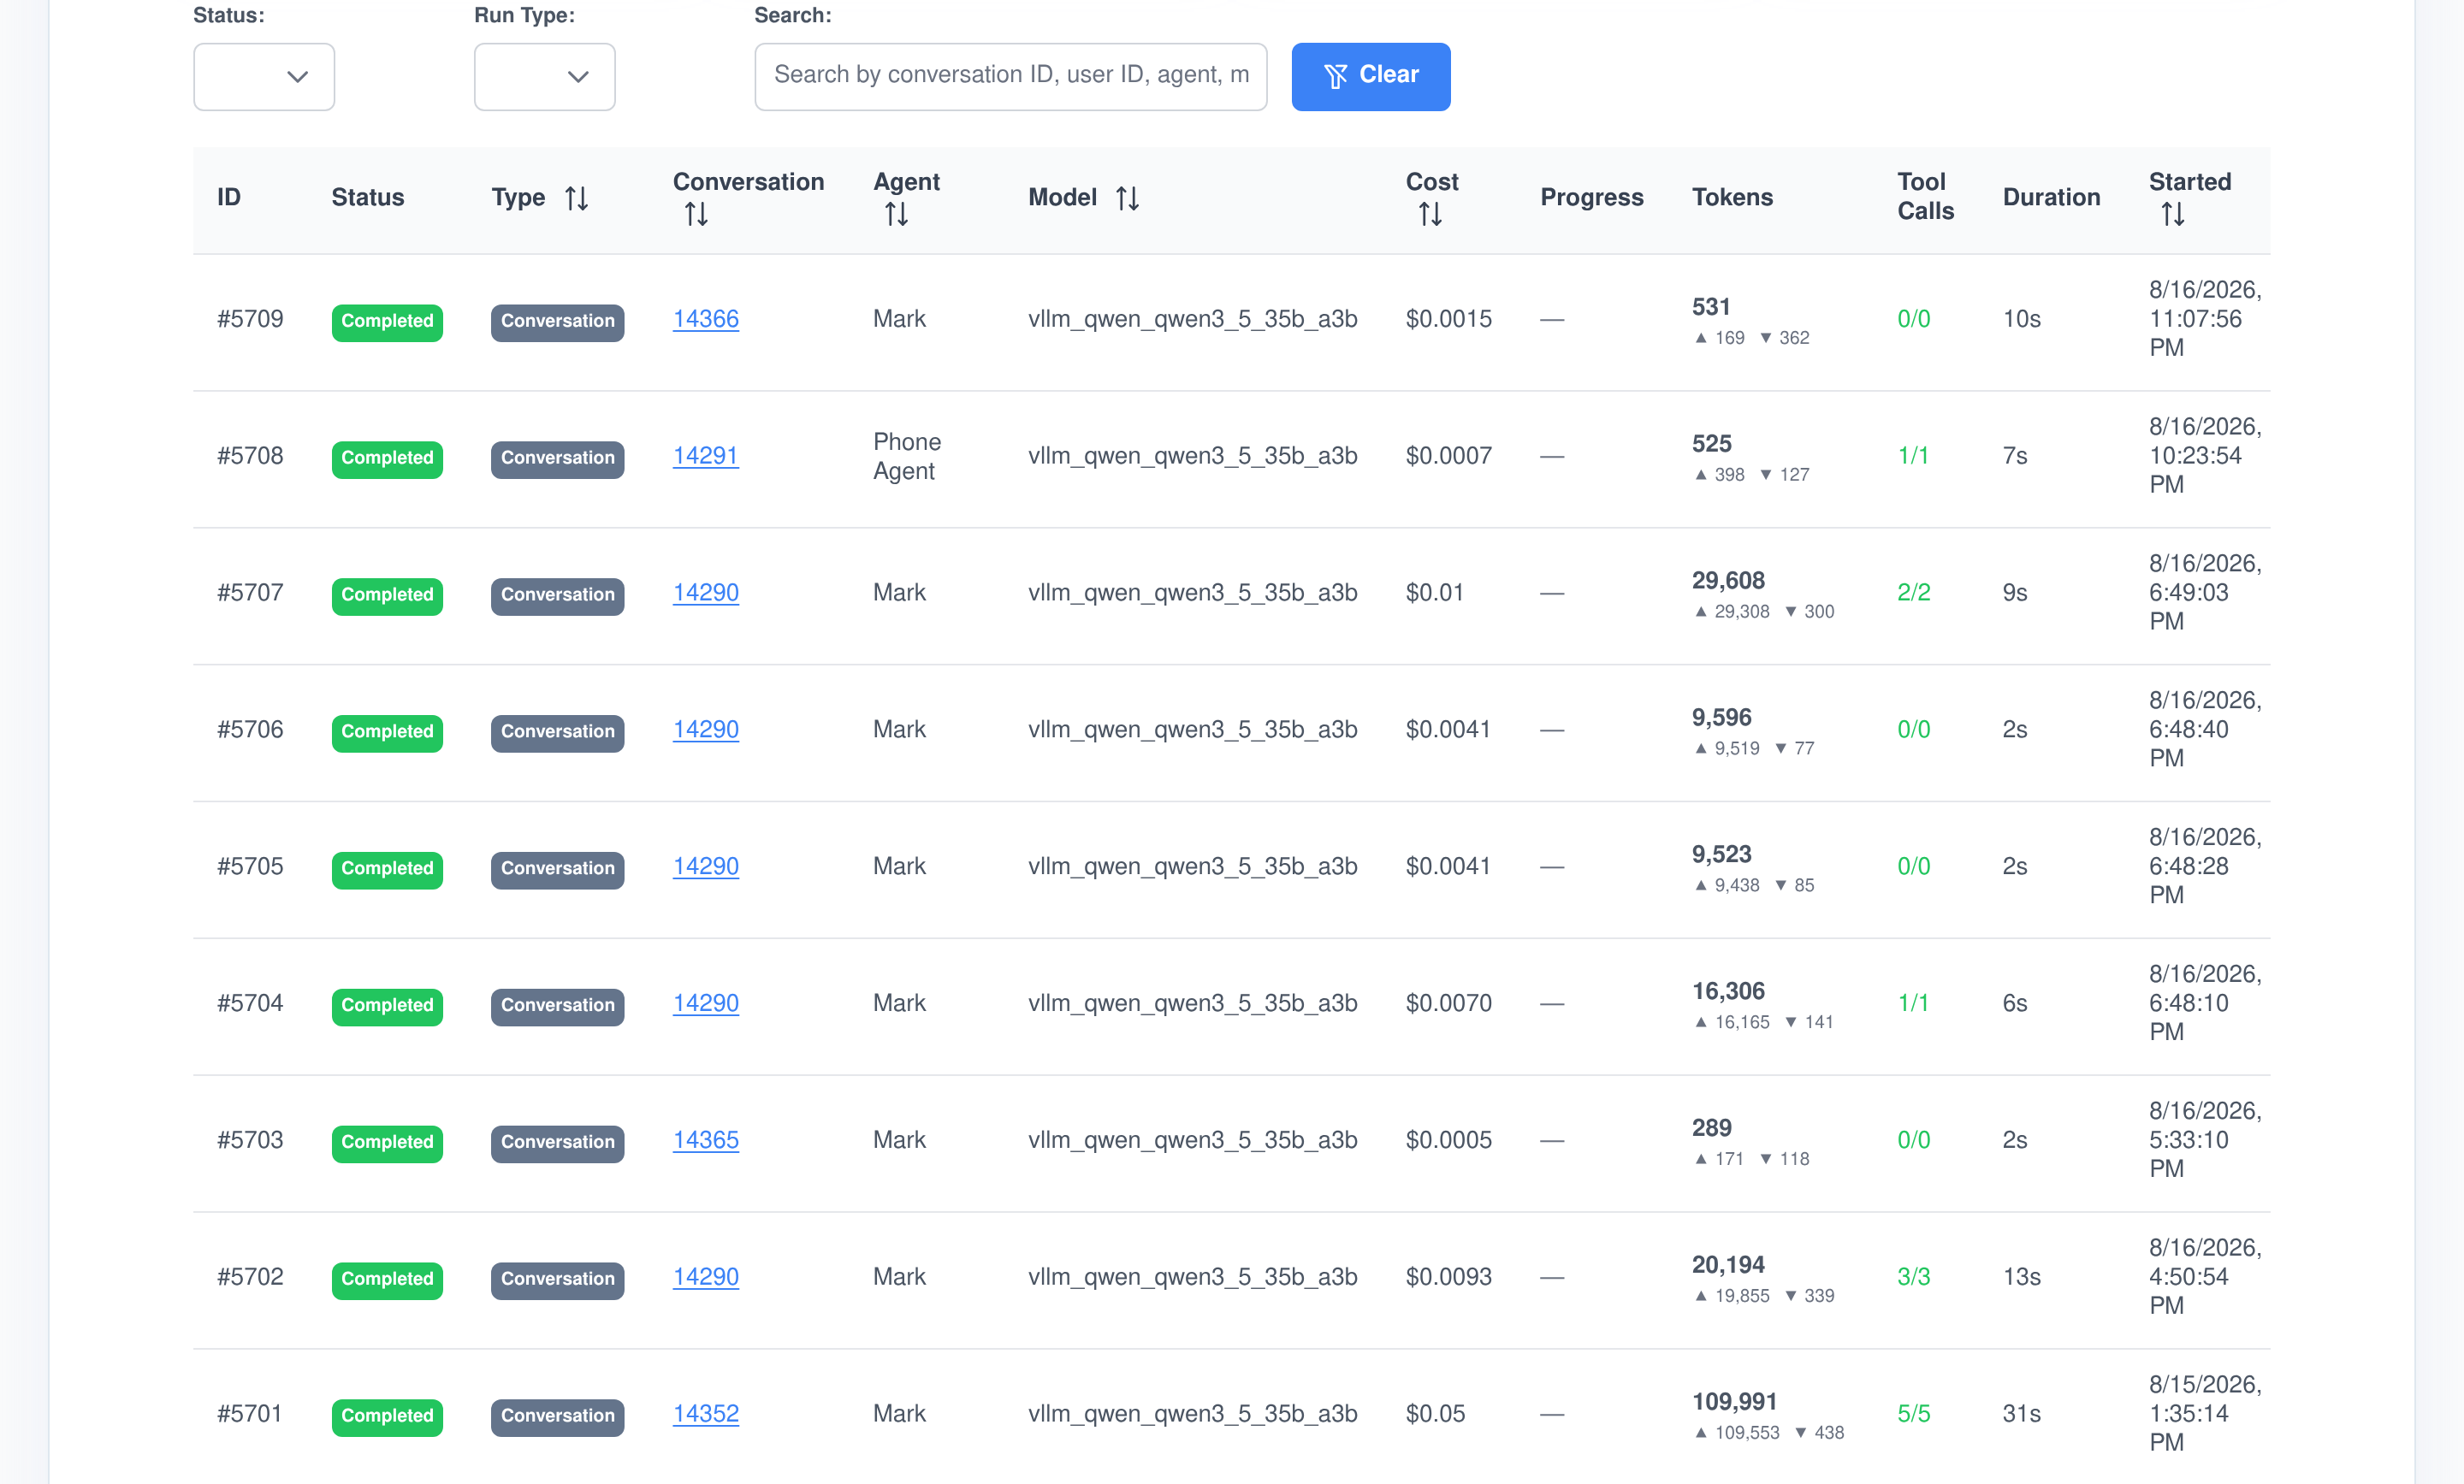
Support says a customer got a strange answer on Tuesday afternoon. You have the conversation id, or the agent, or just the error text. Each row carries enough to recognise the right one without opening it: status, type, agent, model, cost, tokens in and out, tool calls made and how many worked, how long it took and when it started.
Search on what you remember
One box, matched against the conversation id, the user id, the agent name, the model and the error message.
Narrow to the failures
Filter by status and by run type to cut the list down to what went wrong, then sort by cost or by start time to find the one that matters.
Jump into the conversation
The conversation id is a link. It resolves the agent behind that conversation and opens it in the chat, exactly where the user left it.
Open a run and read what actually happened
A row tells you a turn cost a cent and made one tool call. The detail view tells you which tool, what it was asked, what came back, and what the model was thinking when it decided to call it.
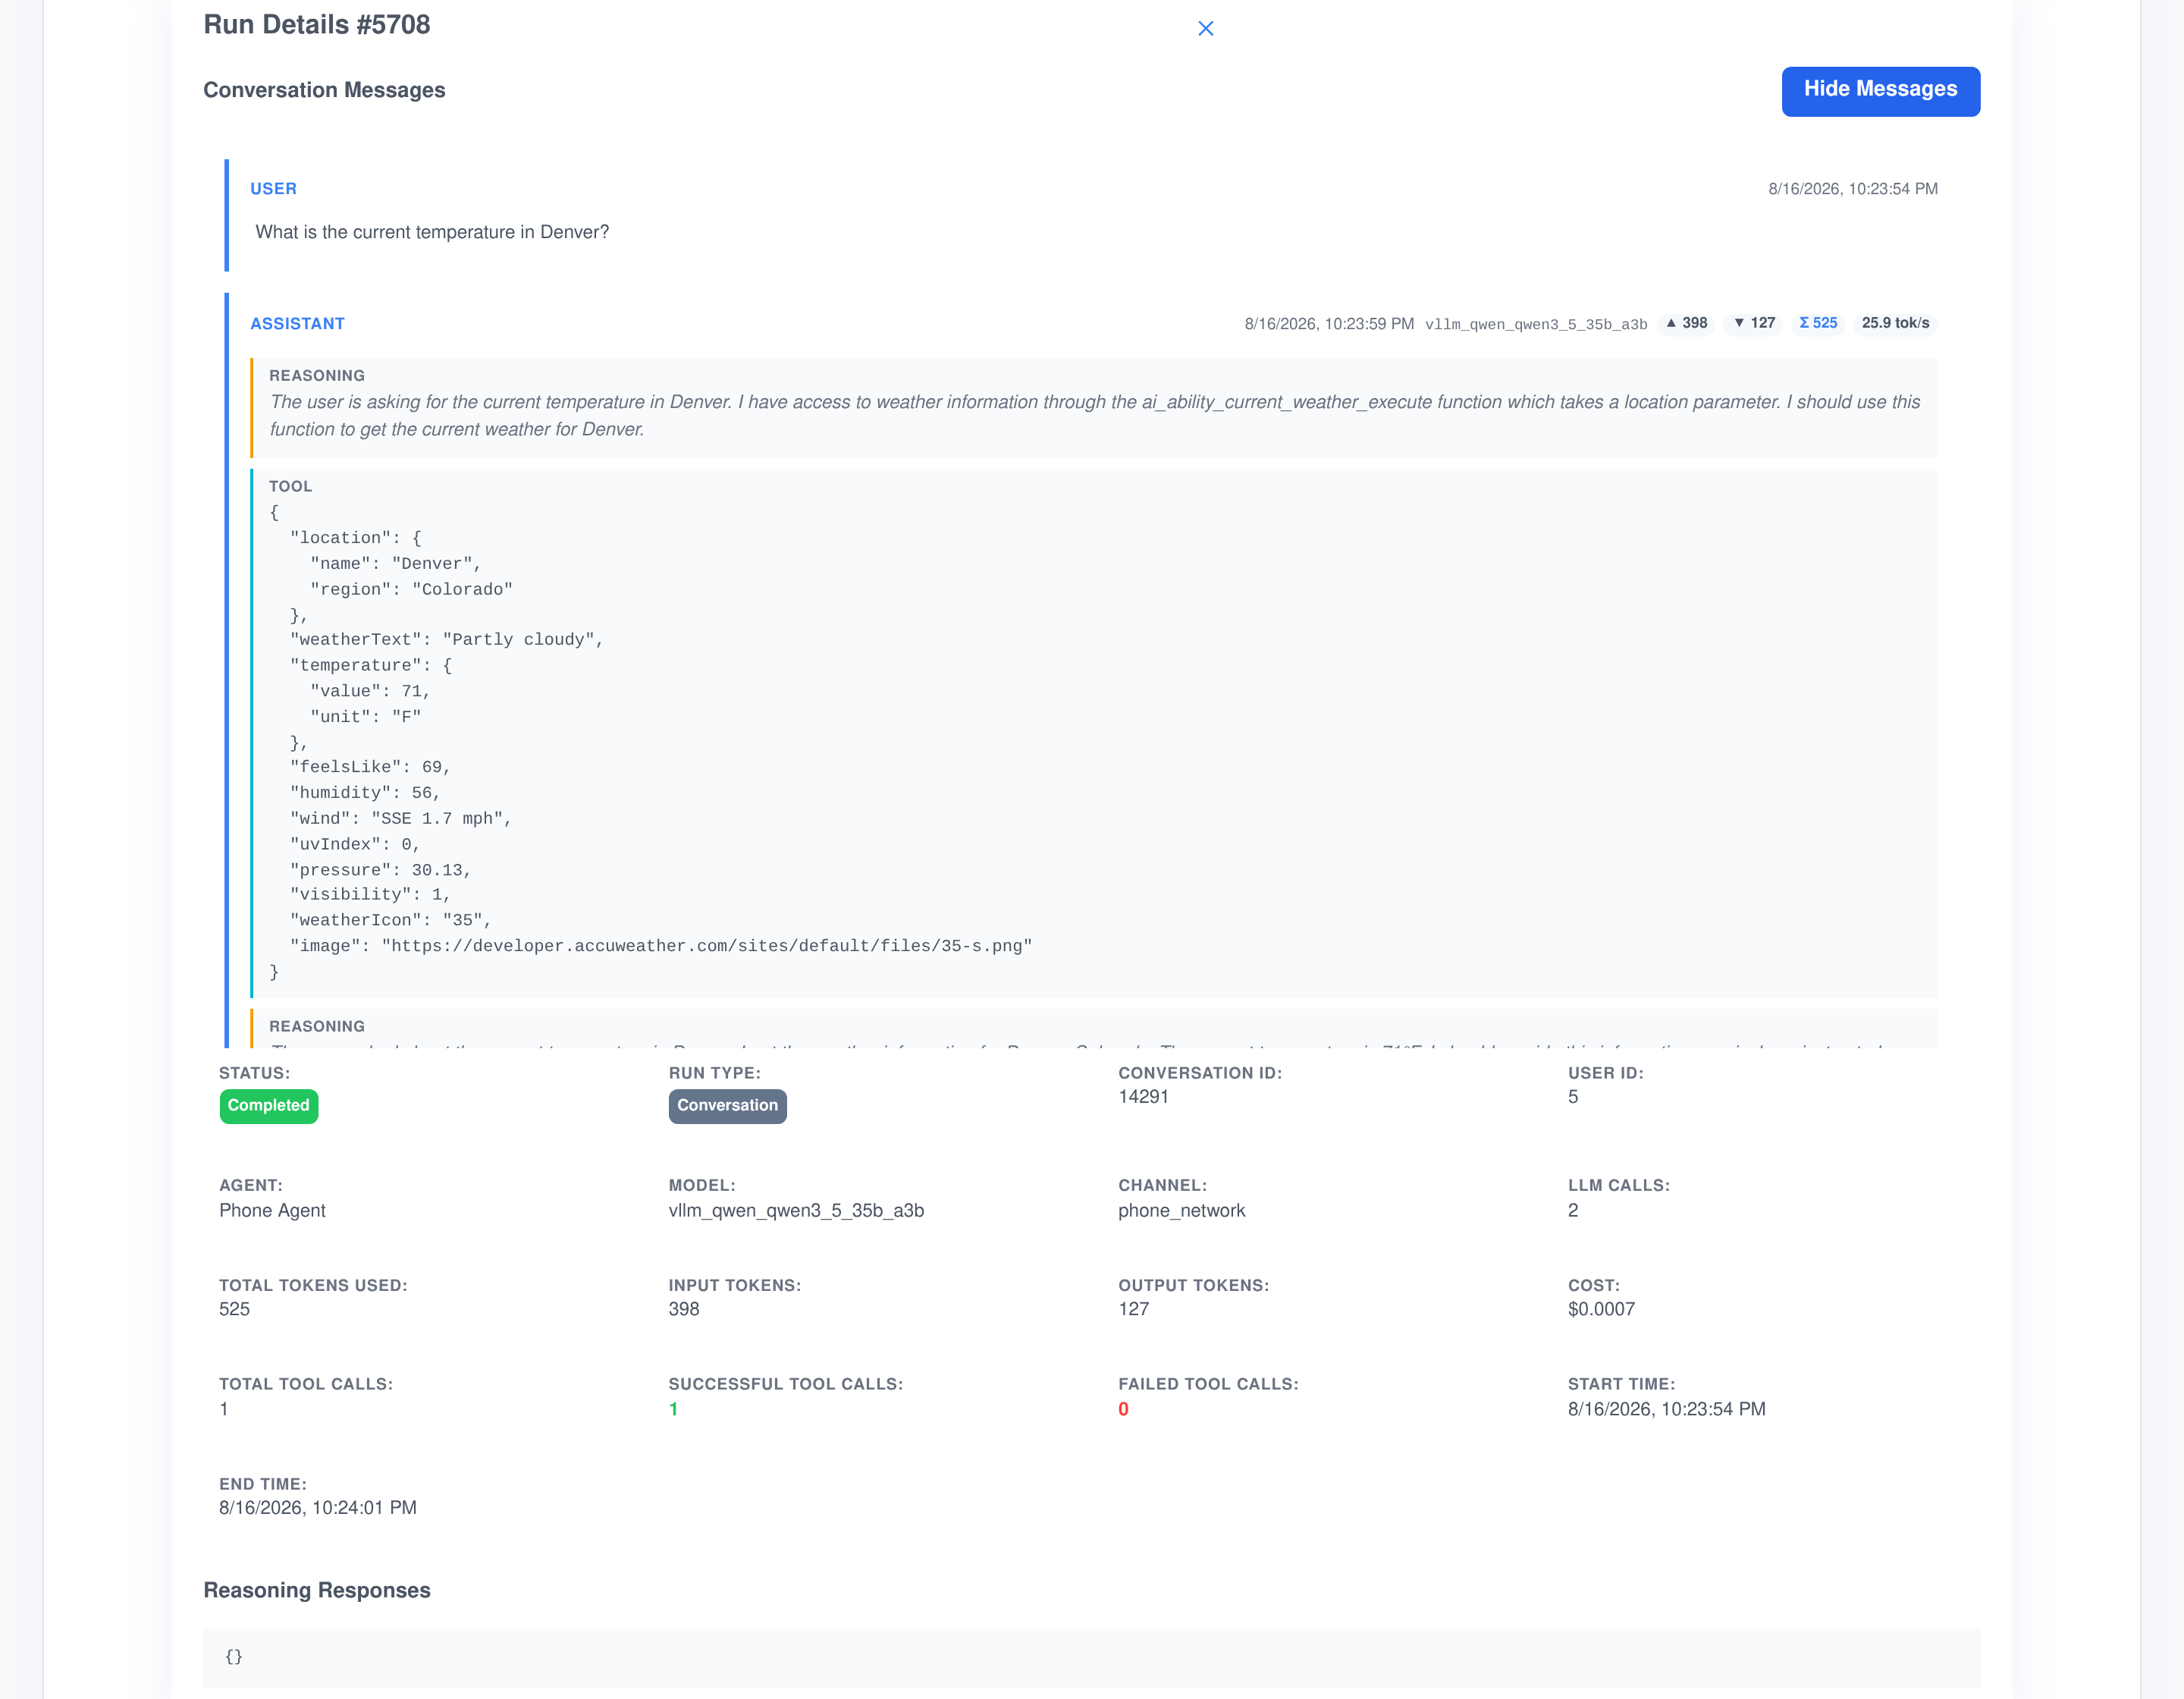
- The turn, step by step. Not just the answer the user saw: the model’s reasoning, each tool call it made, and the raw response each tool gave back, in order.
- Numbers on every message. Which model produced it, input and output tokens, the total, and the tokens per second it ran at.
- The whole record beside it. Status, agent, model, channel, LLM calls, tool calls succeeded and failed, cost, and start and end times.
- Stored conversations are decrypted on read. Message content is fetched through the same guarded path the chat uses, so encrypted history is readable here without being readable anywhere else.
Watch the agents that are still running
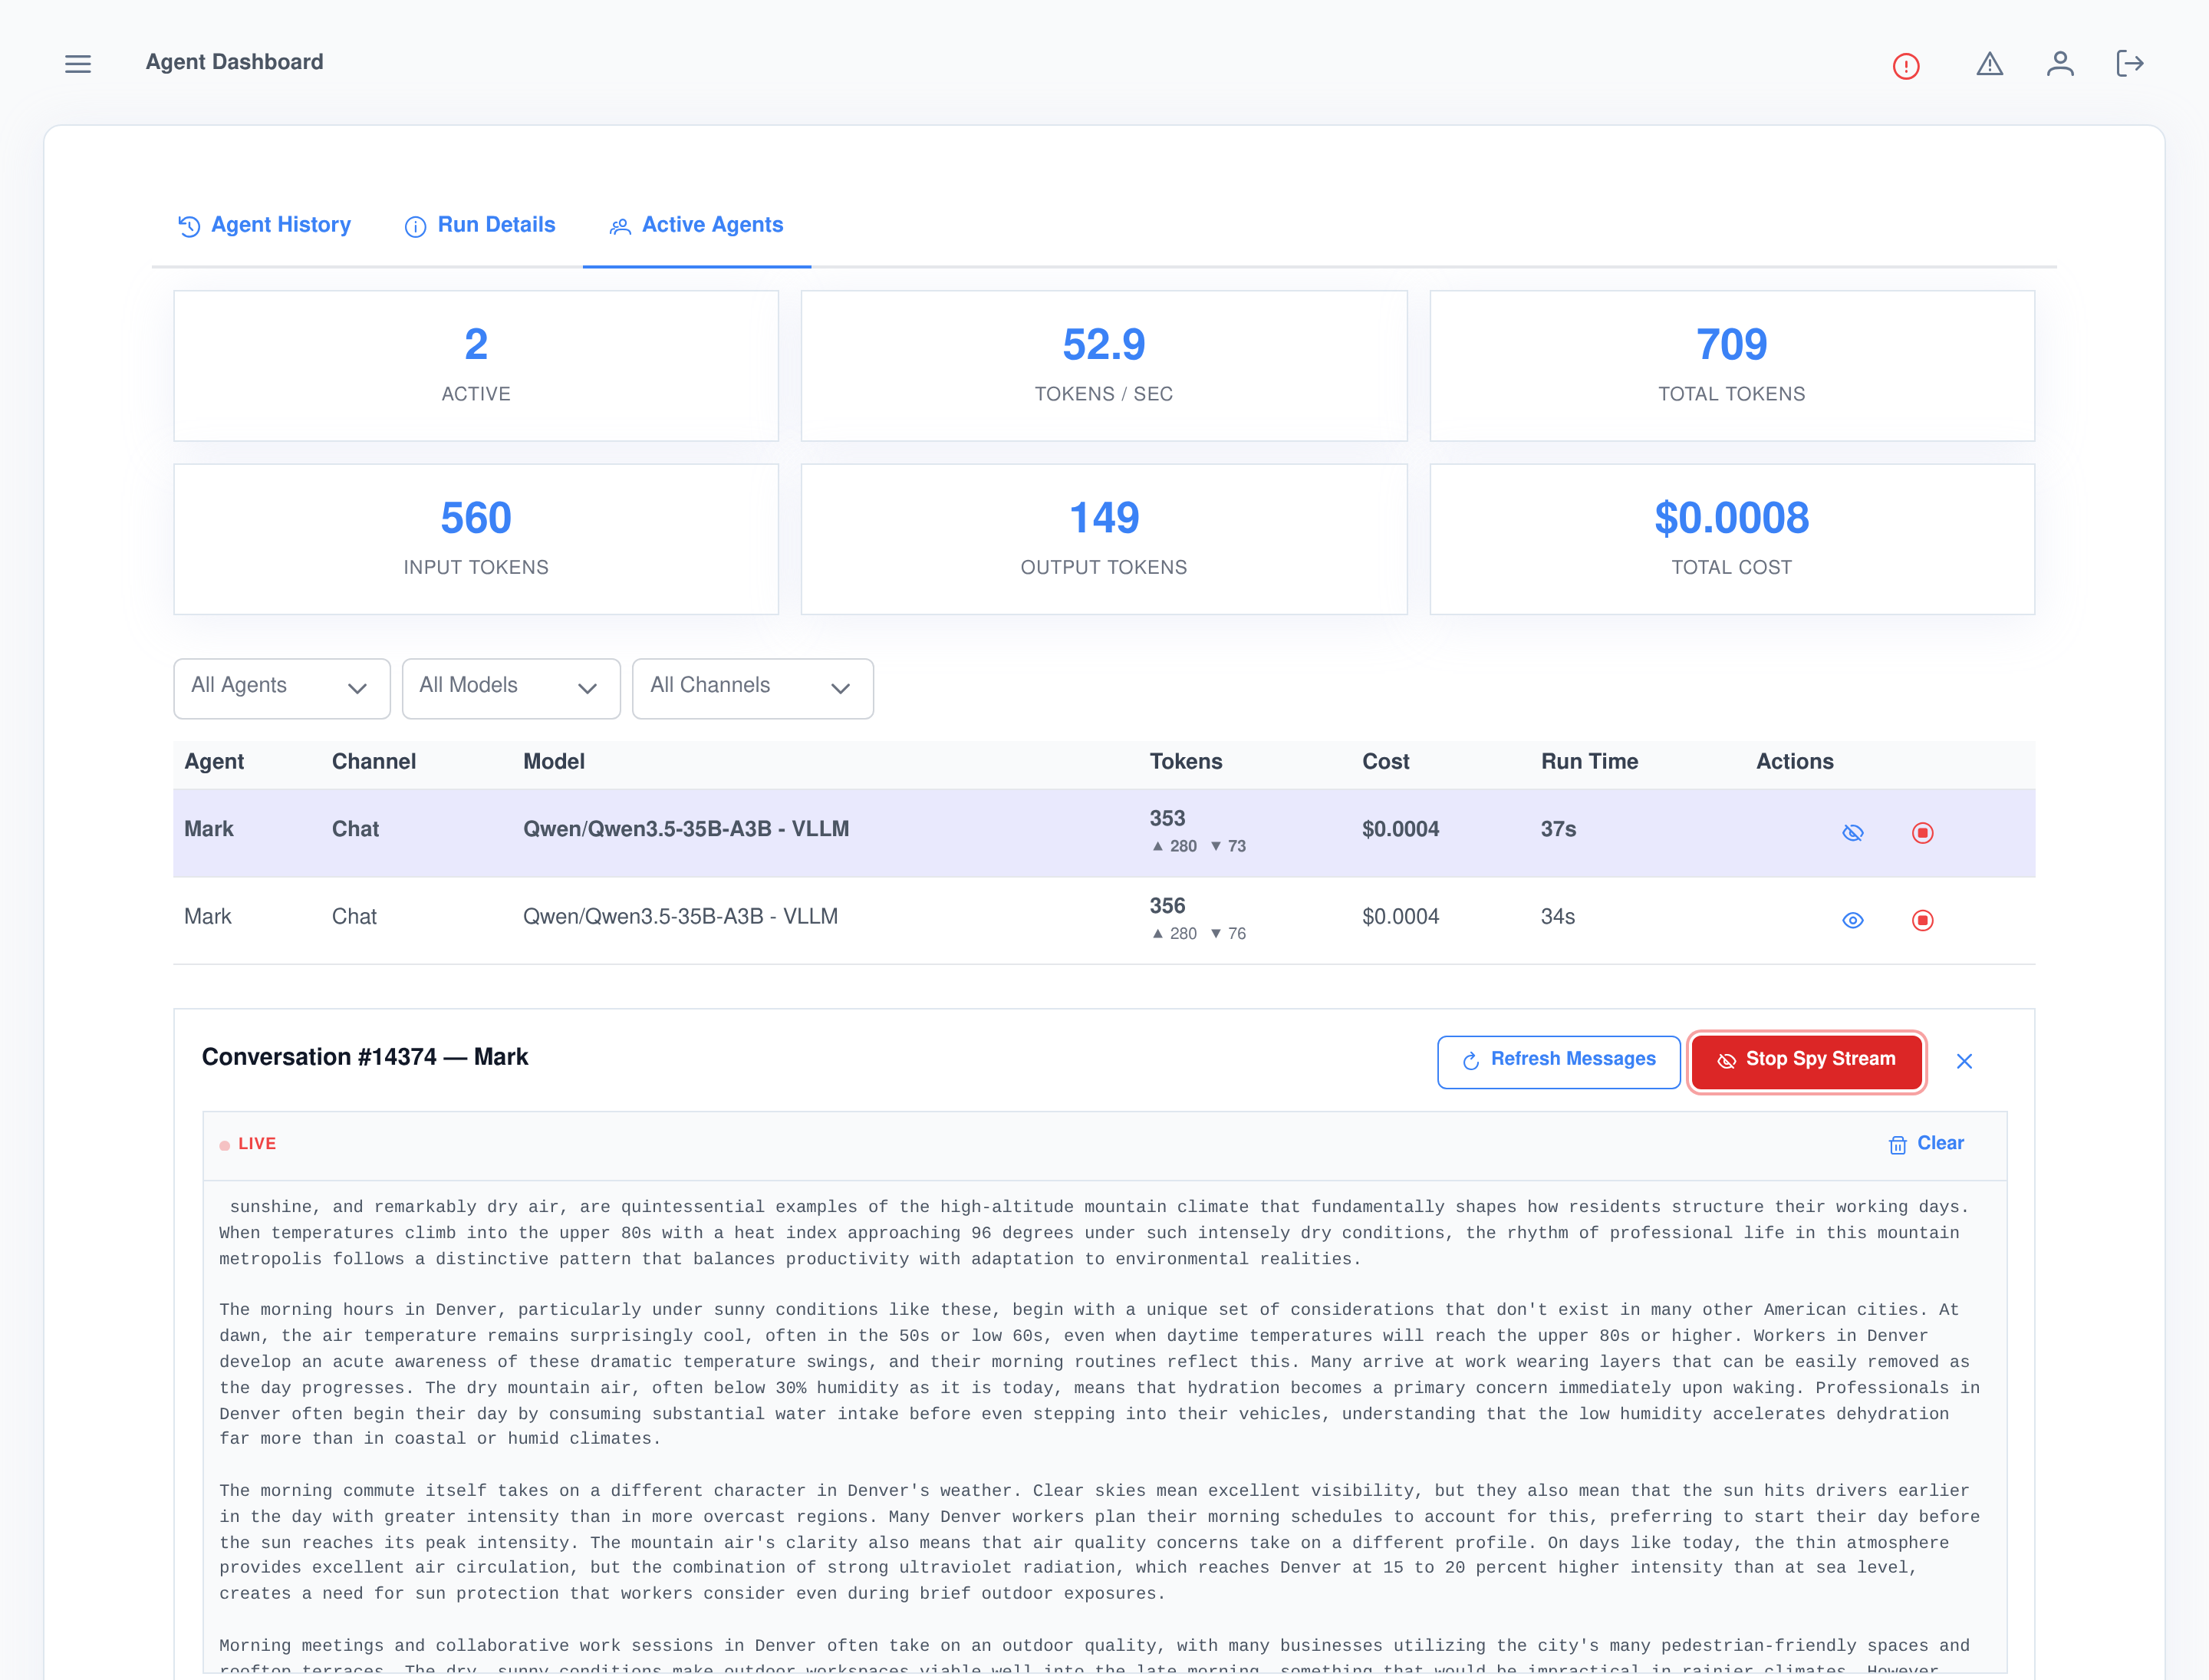
Finished runs explain yesterday. Active Agents is about the conversation generating right now: which agent, on which channel, on which model, how long it has been going, how many tokens it has burned and what that has cost so far. The list is pushed to your browser as conversations start and stop — nothing polls, and nothing needs refreshing.
The spy stream
- Read the output as it is written. Every fragment the model streams is mirrored to your screen, live, while the user is still waiting for it.
- Made for the stuck ones. A model looping on its own thinking looks identical to a slow one from the outside — until you watch it type.
- Off by default, and free when off. Fragments are only mirrored while somebody is actually watching a conversation.
And the stop button
- End a run from the dashboard. Stop generation on a conversation that has gone wrong, without going to find the person who started it.
- Checked before it fires. You can only stop a conversation whose agent you are allowed to reach, and every watching dashboard sees the list update the moment you do.
- Filter the noise. Narrow the live list by agent, by model or by channel when more is happening than fits on a screen.
- Read the messages so far on any live conversation, with the message being generated marked as in progress.
A timeline, not just a snapshot
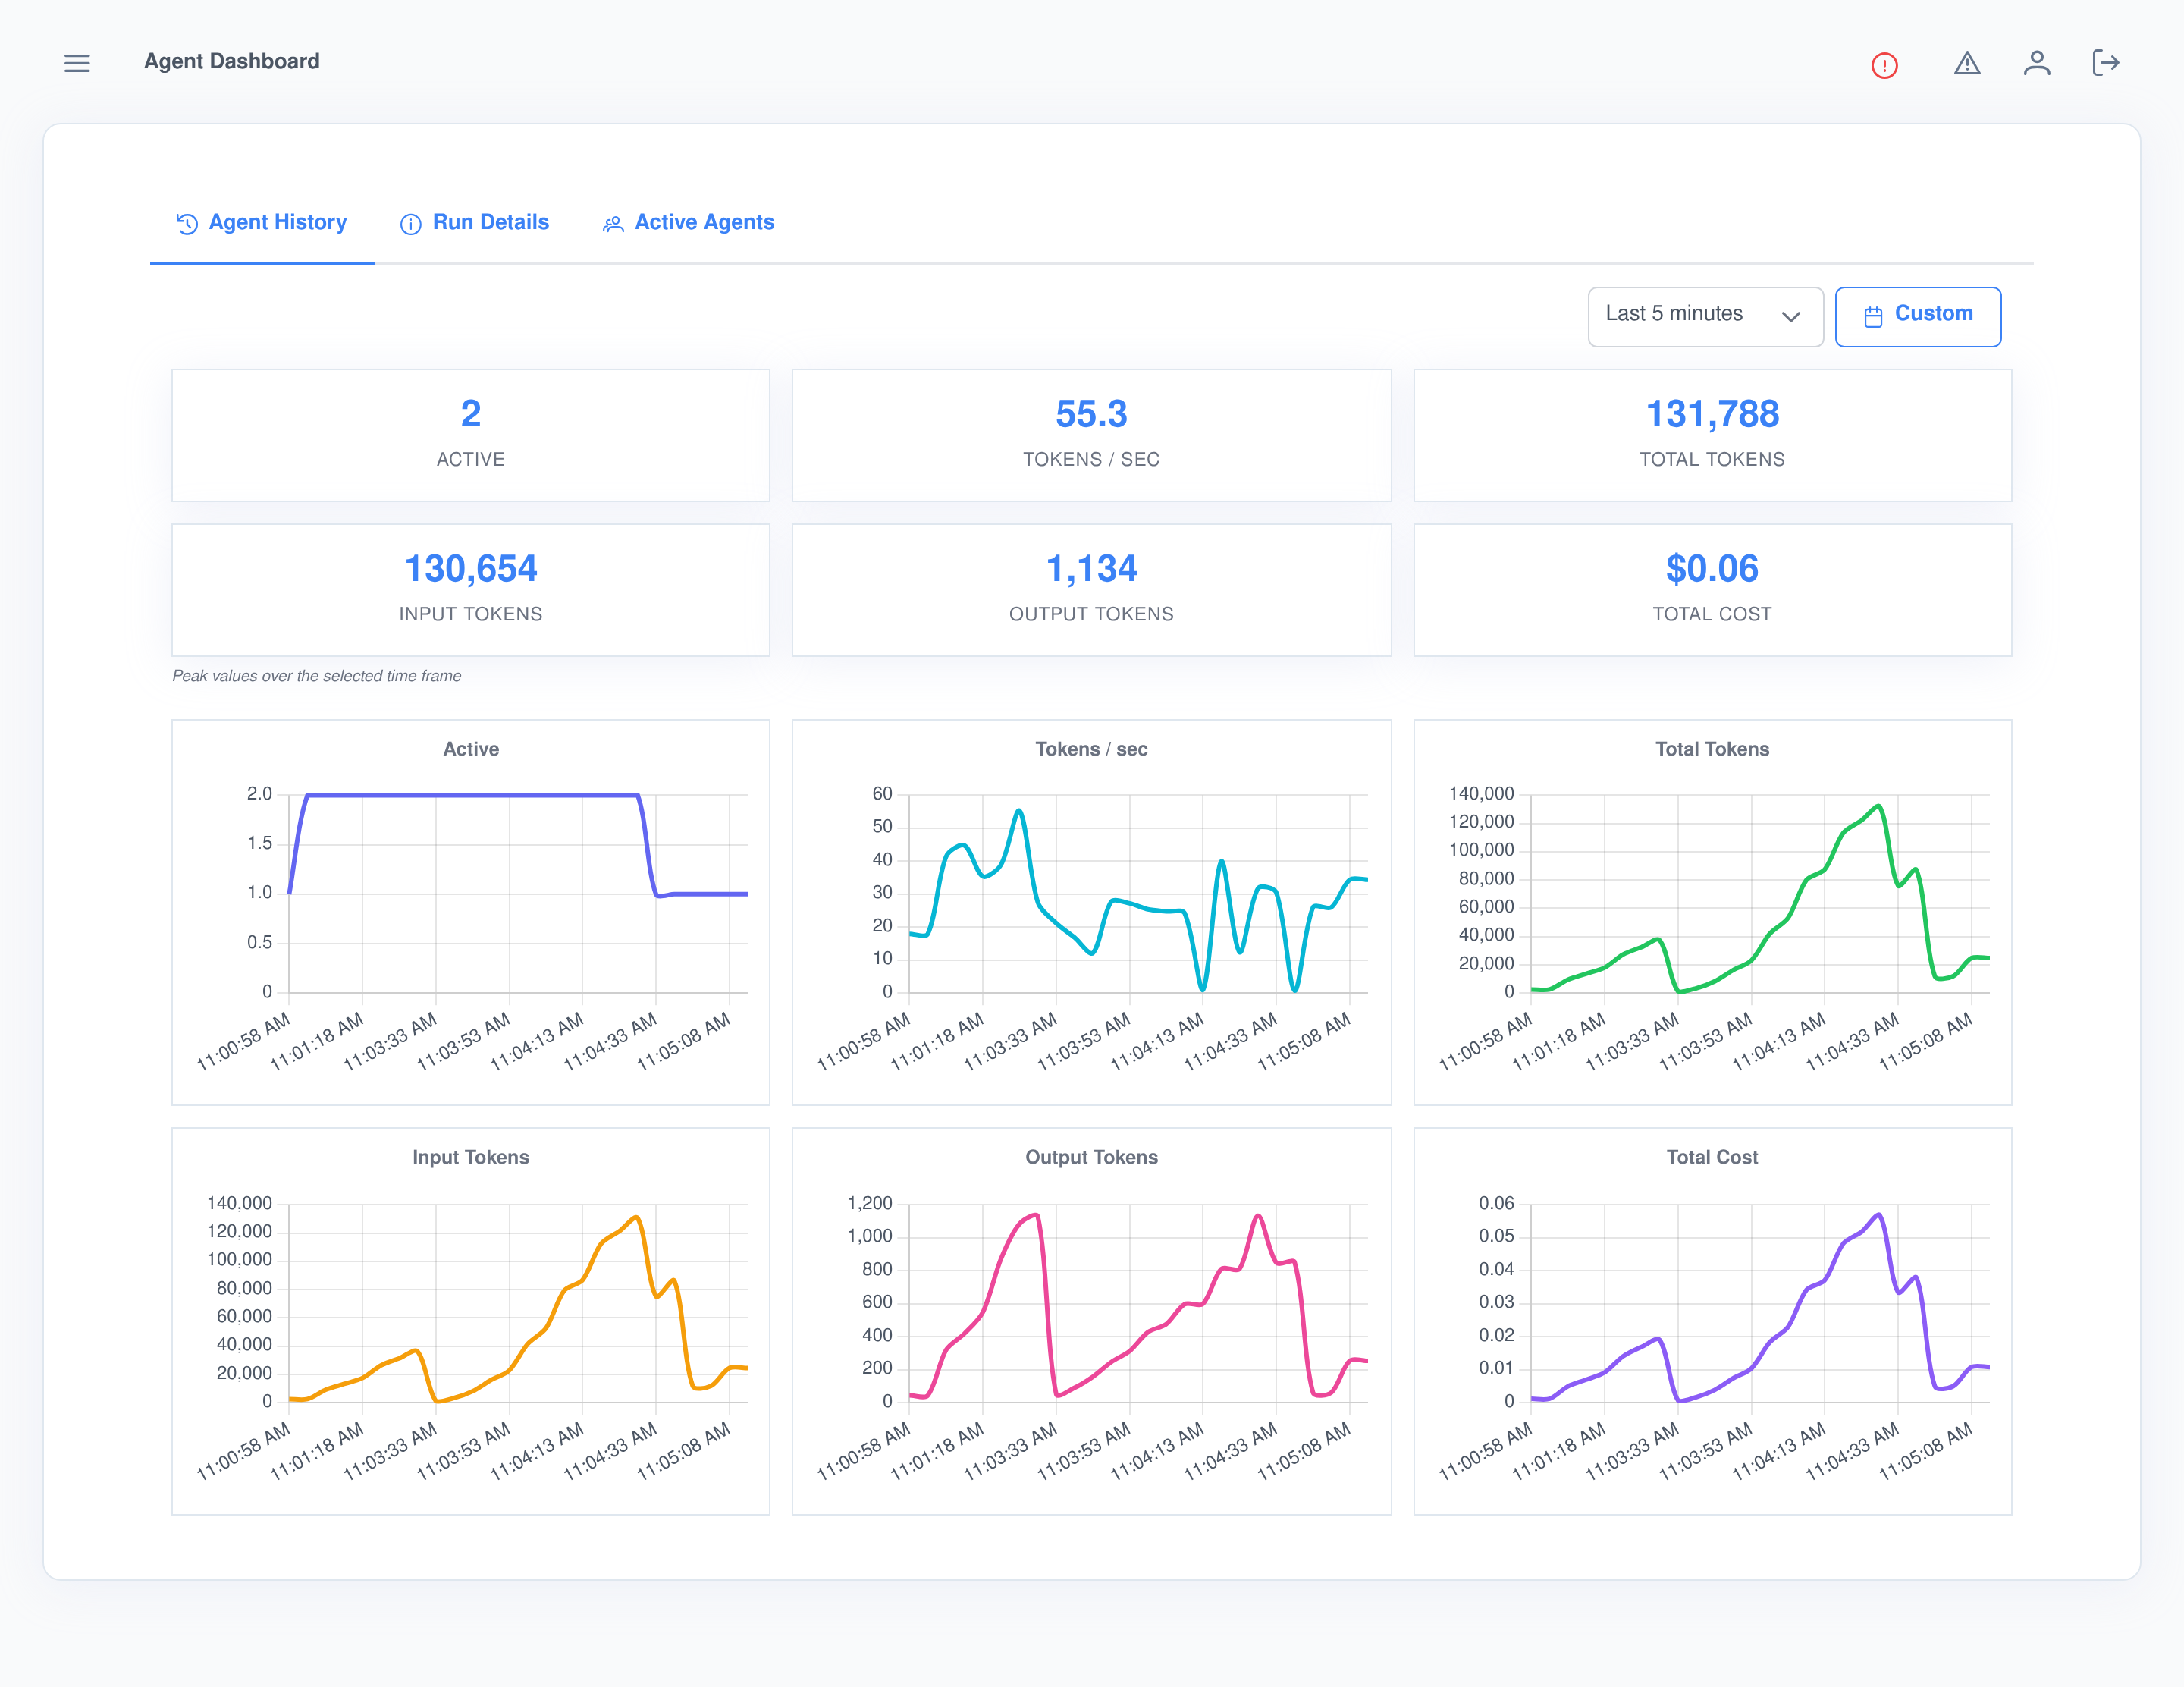
Every five seconds, each conversation in flight is written to a history table. Agent History draws that back as six series — how many agents were busy, how fast they were generating, tokens in, tokens out, tokens total and cost — so a spike at eleven o’clock is something you can point at rather than something you remember.
Pick your window
- Five minutes, thirty minutes, an hour, six hours or a day — or a custom from-and-to when you are looking at something that already happened.
- The tiles above the charts read as peaks over the window, not averages, so a short burst is not smoothed away.
- New snapshots are pushed into the window you are viewing, so a live chart keeps drawing while you watch it.
Kept as long as you want it
- One setting controls how long the five-second history is retained; leave it blank and it is kept indefinitely.
- Old snapshots are pruned on a timer rather than in a nightly job, so the table never needs a maintenance window.
- The timeline is scoped like everything else — you see the agents you are allowed to see, and nobody else’s.
Nothing to instrument, nothing left half-open
It measures from the outside
- No SDK, no decorators, no logging calls. The dashboard wraps the points every turn already passes through: the prompt handler, the processing loop, the end of the turn and the stream itself.
- So it covers everything equally. The abilities that ship with Assistant Cortex, the ones from the marketplace and the ones your team wrote are all recorded the same way, because none of them had to cooperate.
- And every channel. A turn from a phone call is recorded exactly like a turn from a chat window, with the channel on the record to tell them apart.
Interrupted runs close themselves
- A restart does not leave ghosts. A run left open by a crash or a deploy is closed out automatically as failed, with “Run interrupted before completion” recorded as the reason.
- A long run is not mistaken for a dead one. Rows still being worked on are refreshed every few seconds, so only genuinely abandoned runs — untouched for five minutes — are swept.
- Which keeps “running” honest. The count of running agents means what it says, on any day, on any number of API servers.
Monitoring is not a licence to read everything
Three permissions, one default
- Your own runs, by default. Viewing the dashboard shows you your own agent activity. Seeing everybody’s is a separate permission that somebody has to grant.
- Deleting is separate again, and deleting somebody else’s run needs the system-wide permission as well — being an administrator is not enough on its own.
- Live views are checked per agent. Watching a conversation stream, or stopping one, requires access to the agent behind it, not just to the dashboard.
- Pushes are filtered per recipient, so a realtime update never shows somebody a conversation they could not have opened.
And it knows when to forget
- Run records and history snapshots expire under the retention policy of the user whose activity they describe.
- A user data export includes that user’s runs and history, so a subject access request is answered from the product.
- Deleting a user account removes their monitoring records with it.
- The module declares itself against GDPR, CCPA, HIPAA, SOC 2 and PCI DSS, and runs self-hosted or hosted, with models of your choosing — including fully private ones.
What people open it for
- The monthly bill. What agents cost, broken down by the run rather than guessed from a provider invoice.
- The complaint. Someone got a wrong answer — find the run, read the reasoning and the tool responses, and see whether the model or the data was at fault.
- The expensive prompt. Sort by cost and find the turn that quietly pulled a hundred thousand tokens of context.
- The new agent’s first week, watched live on Active Agents while it is still earning trust.
- The stuck run. Watch it stream, confirm it is going nowhere, and stop it from the dashboard.
- The broken integration. Failed tool calls climbing on one agent is a much earlier signal than a user finally reporting it.
Frequently asked questions
Do I have to change my agents or abilities to be monitored?
No. The dashboard attaches to the conversation machinery every turn already runs through, so agents, abilities and prompts are untouched. Install it and the next turn is recorded.
Does it only track certain agents or certain runs?
No. Every prompt turn gets a run record, including a one-line question and a one-line answer, from every agent and on every channel. There is nothing to opt in and nothing to sample.
Where do the cost figures come from?
From your own model pricing. Each run is priced by multiplying its input and output token counts by the per-token rates recorded for the model that produced them. A model with no pricing configured is counted in tokens but contributes nothing to cost.
Can everyone see everyone else’s agent conversations?
No. By default a user sees only their own runs and their own conversations. Seeing system-wide activity is a separate permission, and it is also what is required before anyone can delete another user’s run.
What happens to a run if the server restarts mid-turn?
It is closed out for you. A run left open with nothing working on it for five minutes is marked as failed with “Run interrupted before completion” as its error, so nothing sits in the table claiming to be running for the rest of the week.
Can I stop an agent that has gone wrong?
Yes. Active Agents lists the conversations generating right now, lets you watch one stream token by token, and stops generation on it from the same row — provided you have access to the agent behind it.
How long is the history kept?
As long as you choose. One setting controls how long the five-second activity snapshots are retained, and leaving it blank keeps them indefinitely. Run records follow the retention policy of the user they belong to, and are included in that user’s data export and deletion.
Stop guessing what your agents did
The Agent Dashboard ships with Assistant Cortex. Start a trial, send one message, and watch the run appear.